Brand loyalty is something that marketers strive to achieve throughout their whole career. Those who manage a brand on Amazon need help to map the customer journey and inspire that loyalty. Amazon’s overhaul of Brand Analytics has recently made this mapping easier. We’ll take a closer look at the new tools that are now available in Seller Central.
Customer Loyalty Analytics
This tool gives brand owners insight into the loyalty their brand has developed with Amazon shoppers and can help them engage with those customers. The Customer Loyalty Analytics dashboard includes brand-level customer data trends that can be set during a weekly, monthly, quarterly, or yearly range for all brands registered to the Seller Account.
Customer Segments
Part of the dashboard that can allow brand owners insight into how active their customers are with the brand is the customer segment tool. Amazon has devised this module “…to evenly distribute customers into five quantiles for each of Recency, Frequency, and Monetary factors and allocate a score between 1-5 for each.” Customers are divided into four loyalty segments: Top Tier, Promising, At Risk, and Hibernating.
- Top Tier customers bought recently, buy frequently, and spend the most
- Promising customers bought recently, only buy occasionally, and spend above the average
- At Risk customers haven’t bought recently or frequently and have varied their spending
- Hibernating customers haven’t purchased from the brand in a long time, buy infrequently, and have varied spending
New & Potential Customers
This segment outlines customers new to the brand, orders, sales, potential new customers, and cart abandoners within the selected timeframe. This can help brand owners monitor and grow their customer base on Amazon. Amazon shoppers are loyal to the shopping experience, and ensuring that new customers find your brand provides the opportunity for growth.

- New to Brand Customers: Total number of new customers acquired (purchased for the first time) for the given period. A new customer is a customer who has not purchased from your brand in the last 12 months.
- Orders: Total number of orders from new customers for your brand for the given period
- Sales: Total amount of sales from new customers for your brand for the given period. Total sales include all sales for the period. Returns and non-same-day cancellations are not excluded.
- Potential Customers: Customers who have clicked on your brand, Storefront, and products or added products to their cart in the last 90 days but have not purchased from your brand in the last year.
- Cart Abandoners: Customers who have added any of your brand products to their cart in the last 90 days but haven’t purchased yet.
Repeat Customers
Repeat customers are the lifeblood of a brand. Gaining those customers can be a challenge for brands selling on Amazon. With the insights now available in Brand Analytics, brand owners can track the rate of their repeat customers.
- Repeat Customers – the total number of customers who have ordered products from the brand during the set time
- Repeat Purchase Rate – the total number of customers with repeat purchases/total number of all customers who purchased in the set period
- Average Repeat Purchase Interval – the average time interval in days between repeat purchases
- Orders – the total number of repeat orders for your brand
- Sales – the total amount of repeat sales for the brand – Note that returns and order cancellations that are not same-day are not excluded from this metric.
Insights & Recommendations
Based on the insights provided in the Brand Analytics dashboard, Amazon then provides Insights and Recommendations to improve brand performance. These are suggested actions that a brand owner can take to engage with the given customer segment and help increase your brand’s overall customer lifetime value.
Some of these recommendations could be to send a promotion to those shoppers identified as cart abandoners or new customers who have yet to purchase. Time will tell if Amazon will provide more recommendations beyond promotions.
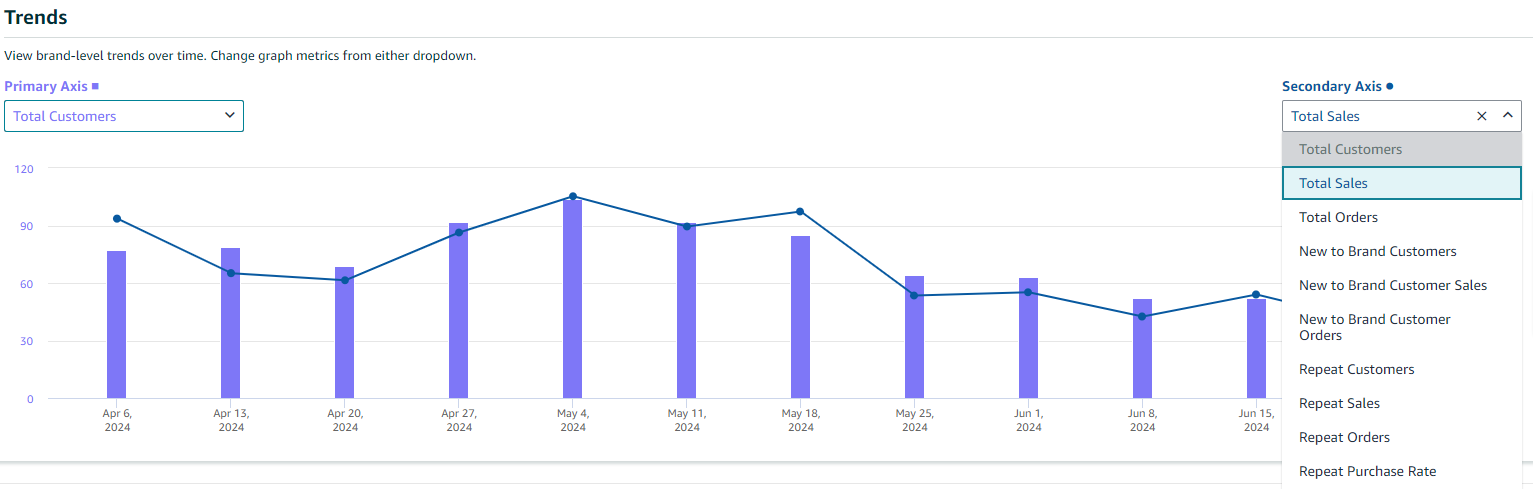
Trends
Finally, the Trends segment provides an interactive line graph to view the brand-level trends over time of your shoppers. Ten different metrics can be plotted on the trends chart to measure the changes in brand performance.
When building brand loyalty in the world of e-commerce, where options are abundant, and customer attention spans are short, brand owners need to keep a close eye on their metrics. Amazon is making it easier with these updates to the Brand Analytics dashboard.